IBM Maximo AI Assistant
Designing agentic AI experiences for asset management.
Role
Sole Product Designer
Team
Project Manager
Design Lead
Engineers
Timeline
Aug 2026 – Dec 2026
Skills
Figma
FigmaMake
BOB
THE MISSION
Transforming Maximo Assistant from flat tables into clear visual insights that help maintenance teams understand operational data faster.
As the sole Product Designer on data visualization for IBM Maximo, I owned the experience end to end, from early exploration through final handoff to engineering. The goal was to help enterprise maintenance teams make sense of their operational data at a glance instead of digging through rows of numbers to find what mattered.
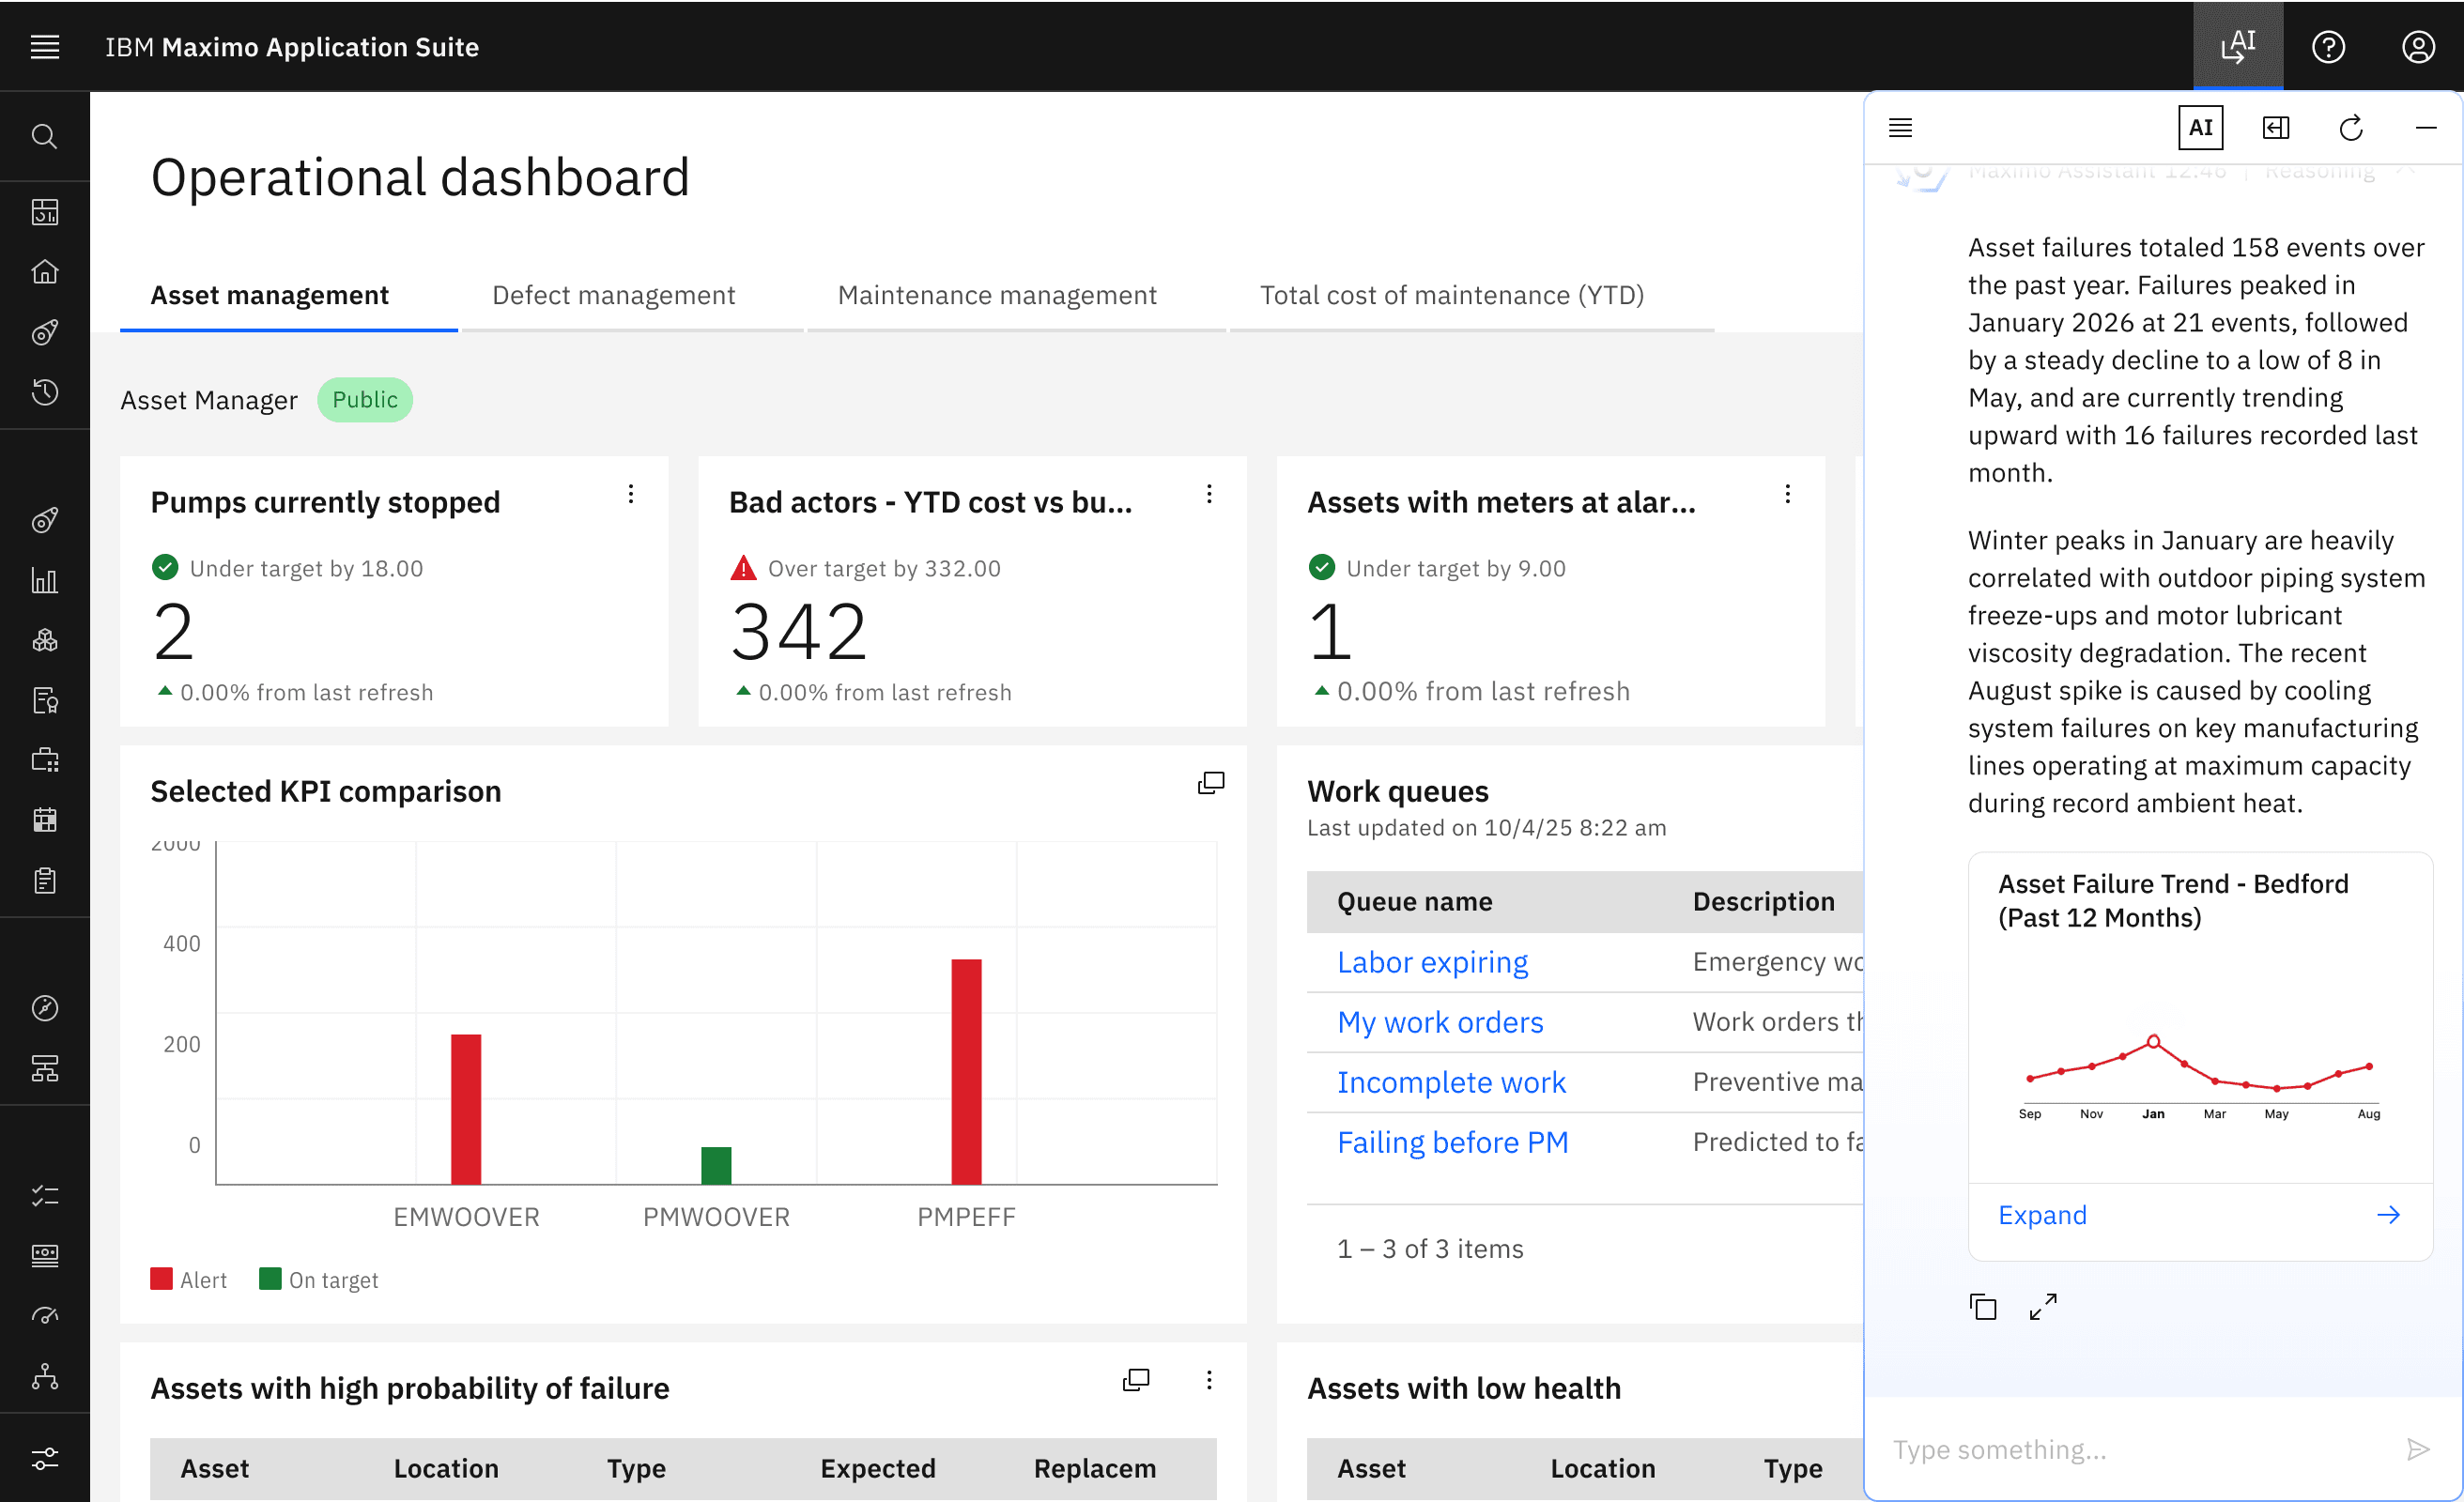
Maximo Assistant answers questions in natural language, but its responses often came back as dense tables. I designed how those answers become charts that people can open up and explore, with a clear path back to the records underneath, so that AI-generated insights feel trustworthy enough to act on.
Much of the work happened beyond individual screens. Partnering closely with engineering and product, I shaped the rules behind the system itself: when an answer should become a chart rather than a table, and how visualization patterns hold up as the questions and data behind them change.
ON MY DESK
Learning the language of data visualization
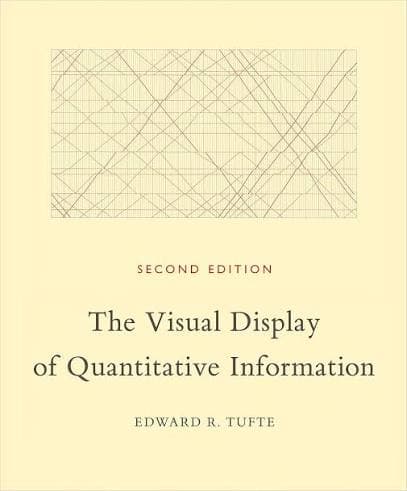
I came into this role with no background in data visualization. Besides my manager and everyone at IBM who's been so generous with their time, one of my biggest resources has been Edward R. Tufte's The Visual Display of Quantitative Information.
It gave me the fundamentals to build on and, just as important, the vocabulary to put what I was seeing into words.
Want the full walkthrough?
This work is locked for now. Leave your email and I'll get back to you to set up a time to talk through it.
IN THE WORKS
A look inside my time at IBM
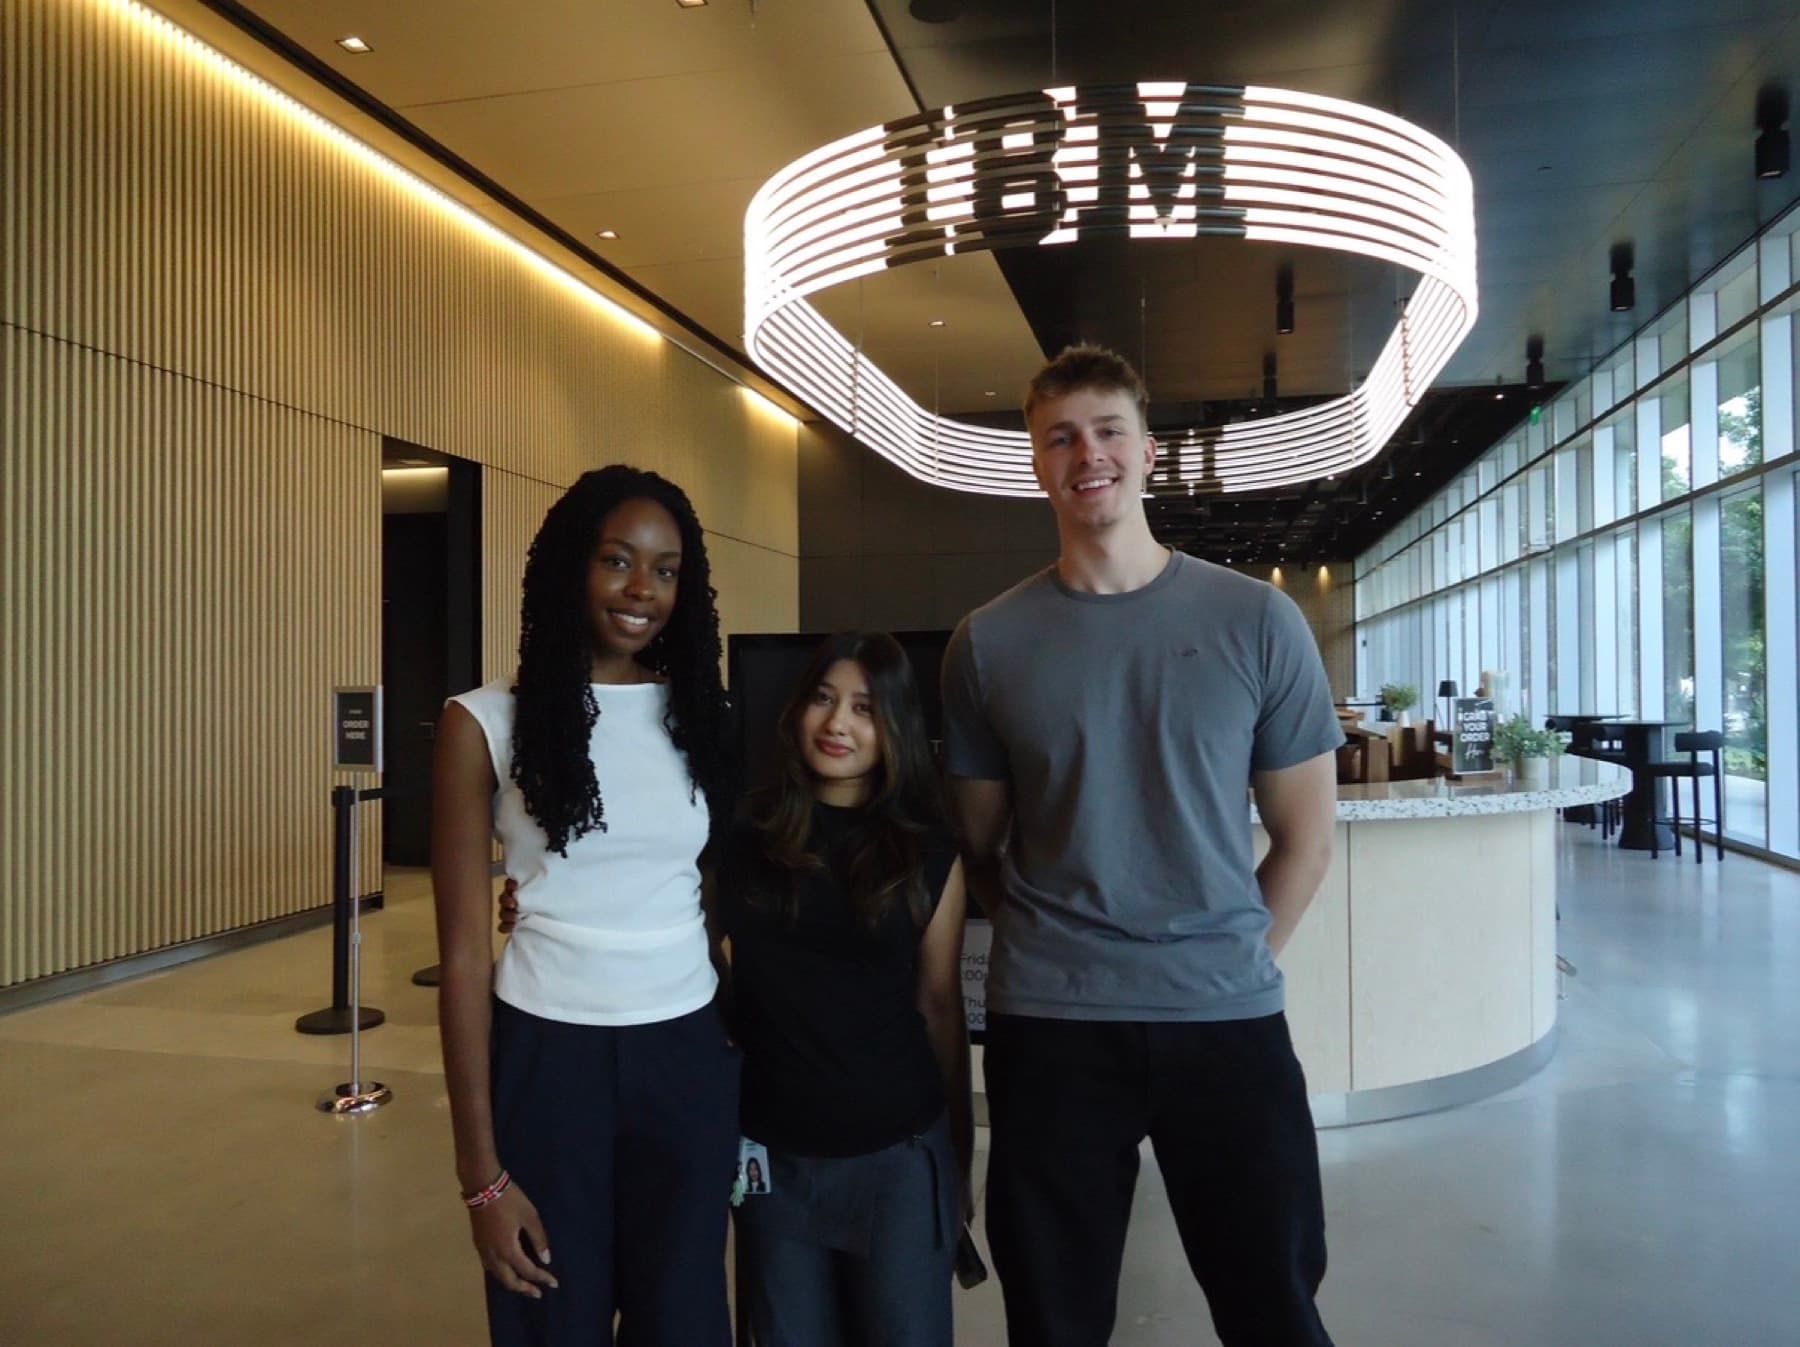
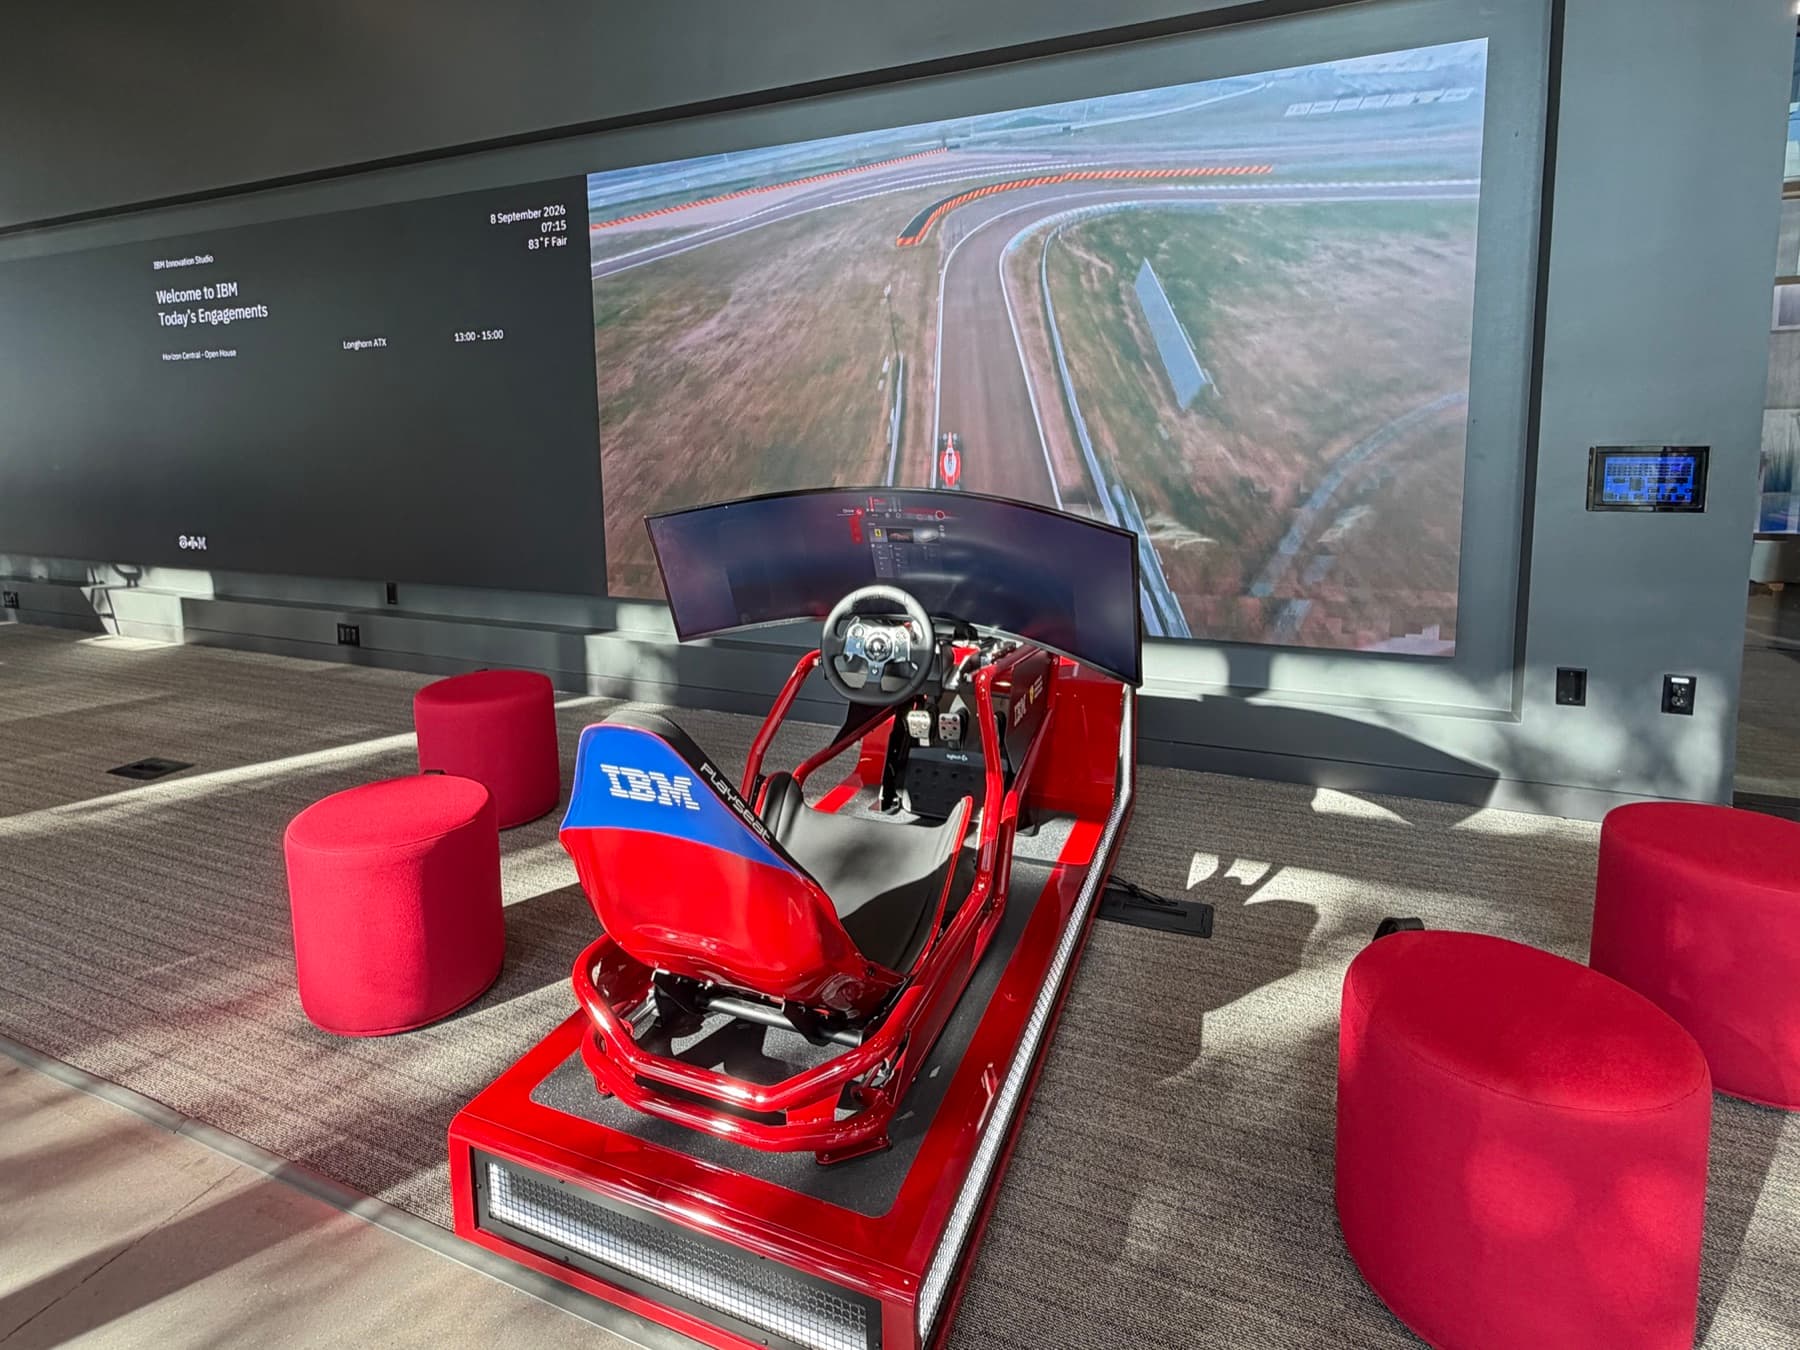
The full case study is still in progress while my work at IBM continues. In the meantime, here are a few moments from my time on the team so far.